Authors:
Diana Caballero Díaz, Central Bank of Paraguay – BCP. Email: – dcaballero@bcp.gov.py
Carlos Giraldo, Latin American Reserve Fund – FLAR, Bogotá, Colombia. Email: – cgiraldo@flar.net
Iader Giraldo-Salazar, Latin American Reserve Fund – FLAR, Bogotá, Colombia. Email: – igiraldo@flar.net
Marco Navarro Rodríguez, Central Bank of Paraguay – BCP. Email: – mnavarro@bcp.gov.py
In an earlier post, we presented some preliminary results from the joint study between the Central Bank of Paraguay and FLAR on “Characterization of Direct Investment (DI) in Paraguay: A Sectoral Analysis for the 2008-2024 Period.” These showed that, between 2008 and 2024, Direct Investment (DI) in Paraguay averaged annual net flows of USD 590 million (1.6% of GDP), coming from a growing number of investor countries: from 39 in 2008 to 68 in 2024. Drawing on firm-level information compiled by the Central Bank of Paraguay (BCP), this post takes a closer look at the sectoral dimension of those flows: which economic activities receive this capital, and what characteristics distinguish the recipient firms across the different sectors?
When classifying DI-recipient firms into four broad sectors: primary, manufacturing, financial services, and non-financial services, the latter (trade, real estate activities, telecommunications, transport, among others) stand out as the main recipient, with 44% of accumulated flows between 2008 and 2024 (Table 1). Manufacturing follows (26%), then financial services (20%) and the primary sector (10%).
This composition has shifted significantly across sub-periods, reflecting changes in the dynamics and determinants of these flows. The share of non-financial services peaked between 2012 and 2015 (60%), driven mainly by flows into transport, trade, and real estate activities. By contrast, manufacturing’s share fell from 39% in 2008-2011 to just 11% in 2012-2015, a period in which flows were concentrated mostly in industries directly linked to the primary sector. Manufacturing subsequently rebounded to account for 44% of flows between 2016 and 2019, supported by a more diversified sectoral base that included activities such as meat, auto parts, glass, and chemical and pharmaceutical products, several of which benefited from special tax incentive regimes. Financial services, for their part, reached their highest historical share between 2020 and 2024, at 25% of the total.
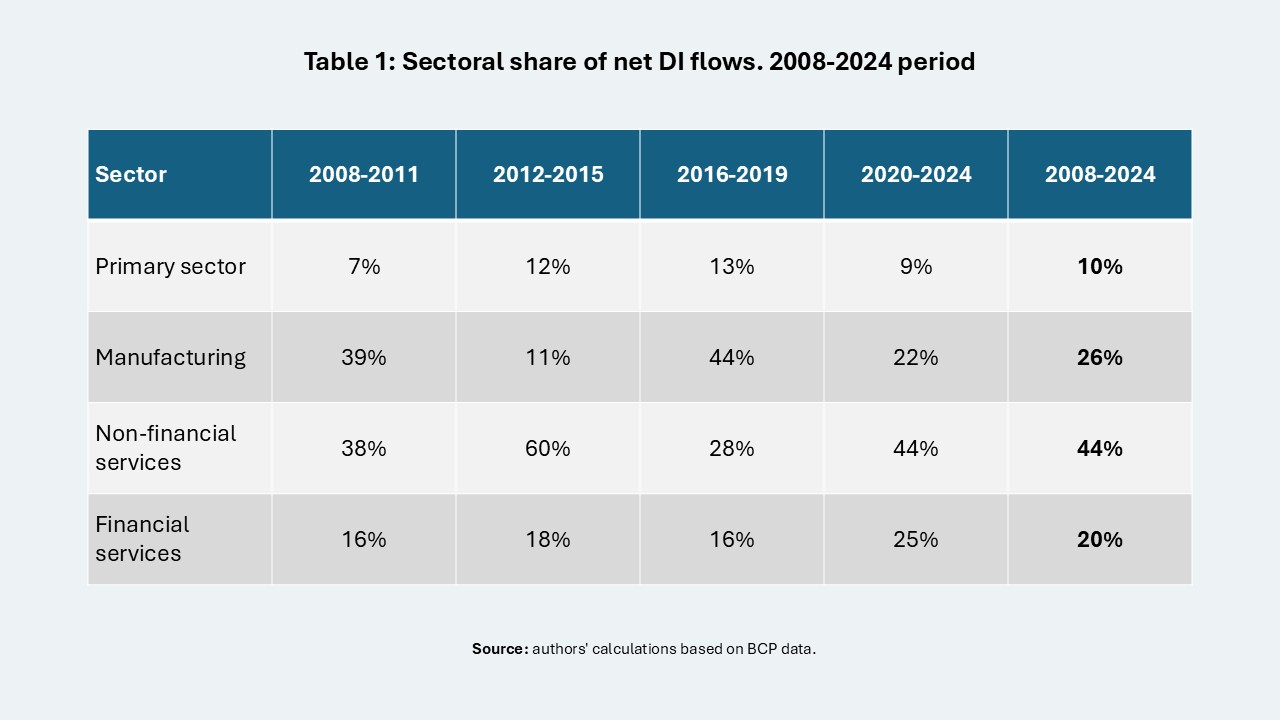
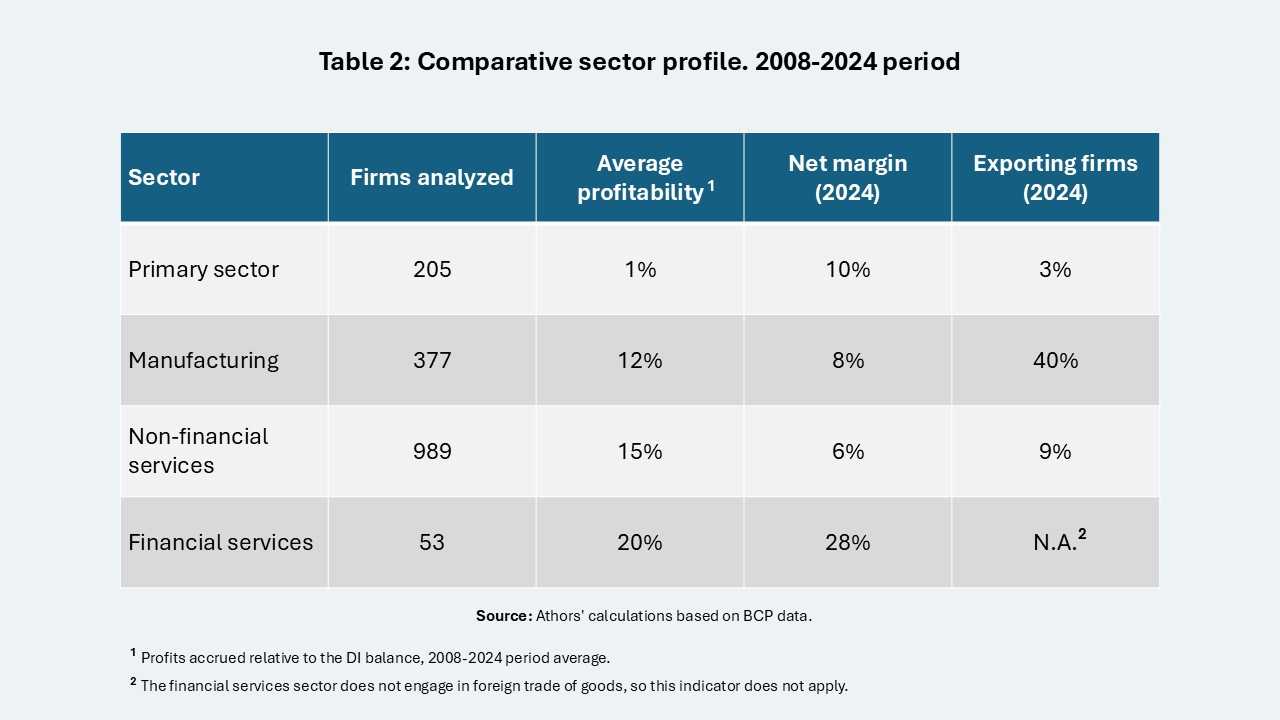
The primary sector, livestock, forestry, and crops, has the smallest share (10% on average), although it is one of the most dynamic in terms of the number of firms: it grew from 44 firms in 2008 to 192 in 2024, driven by international demand for agricultural commodities between 2012 and 2014. Its flows, however, turned negative from 2016 onward, coinciding with the drop in international agricultural prices, and its average profitability (1%) is the lowest of the four sectors.
Manufacturing, by contrast, saw its 377 analyzed firms grow from 74 in 2008 to 334 in 2024, with flows heavily concentrated in large firms: 40% of firms fall into this category and account for 70% of the total. It is, moreover, the sector with the strongest export orientation: 4 out of 10 DI-recipient firms sold abroad in 2024, and the sector as a whole ran a trade surplus in every year of the analyzed series, with soybean meal and oil, beef, and tanned leather standing out among the exported products.
Non-financial services, with 989 firms analyzed, is the largest sector by number of firms and the one that concentrates the most flows, driven by wholesale trade, transport, real estate activities, and, more recently, telecommunications and data processing. Its average profitability (15%) is the second highest, but its net margin (6% in 2024) is the lowest of the four sectors and, unlike manufacturing, its foreign trade in goods runs a deficit in most years, reflecting its orientation toward the domestic market.
Financial services, in turn, banks, finance companies, insurers, and exchange houses, is the sector with the fewest firms (53 firms analyzed), but the most profitable: an average rate of profits over the DI balance of close to 20%, and a net margin of 28% in 2024, both the highest among the four sectors (Table 2). It is also the most concentrated sector, as roughly 90% of flows are concentrated in the five largest firms.
Behind Paraguay’s solid aggregate DI performance, then, quite different sectoral dynamics coexist: a profitable but firm-concentrated financial sector, an export-oriented manufacturing sector with a trade surplus, non-financial services that attract the largest volume of capital despite a lower margin, and a more dynamic primary sector tied to the international evolution of commodity prices. This level of detail, made possible by the joint work between the BCP and FLAR on granular firm-level information (see study), is particularly valuable at a time when Paraguay has been showing very good macroeconomic indicators, and when understanding the particularities of each sector will be key to guiding the country’s investment-attraction and productive-diversification policy.