Authors:
Diana Caballero Díaz, Central Bank of Paraguay – BCP. E-mail: dcaballero@bcp.gov.py
Carlos Giraldo, Latin American Reserve Fund – FLAR, Bogotá, Colombia. E-mail: cgiraldo@flar.net
Iader Giraldo, Latin American Reserve Fund – FLAR, Bogotá, Colombia. E-mail: igiraldo@flar.net
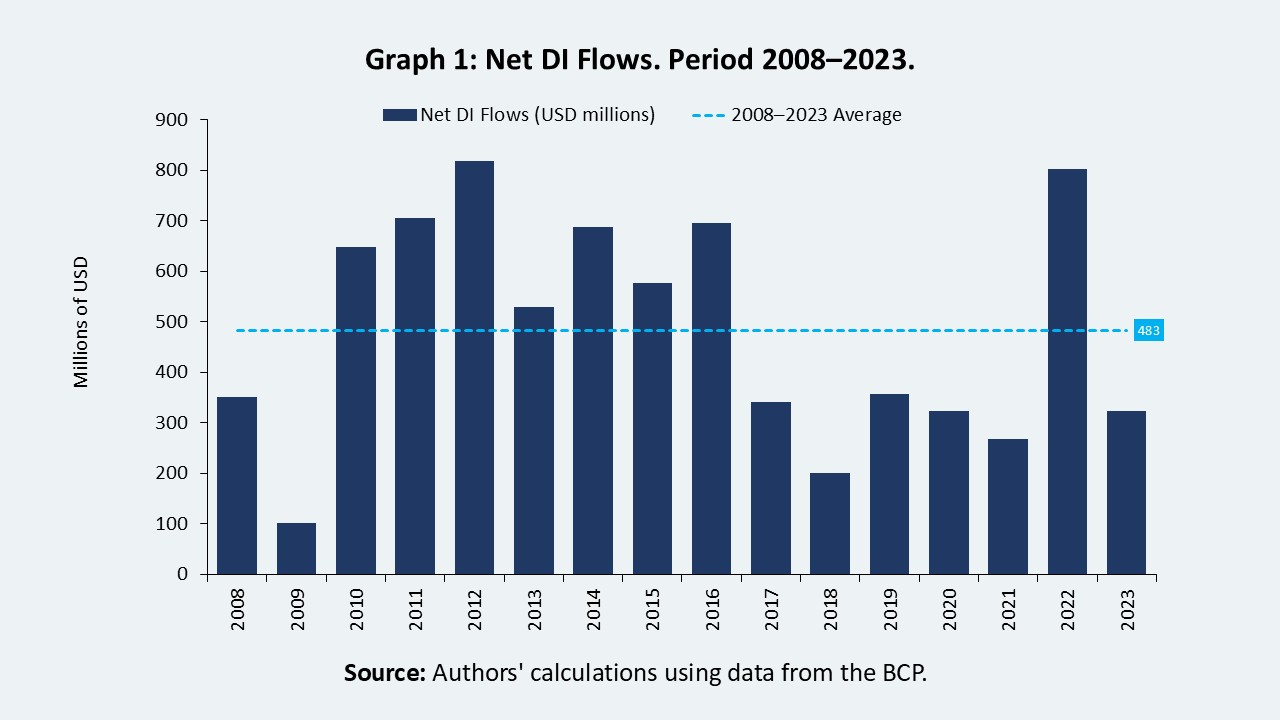
Direct Investment (DI)1 in Paraguay has been influenced by various economic and structural factors over the past decades. From the economic boom of the 1970s, driven by major infrastructure projects and active investment incentives, to the liberalizing reforms of the 1990s and sectoral diversification in the twenty-first century, the development of DI has been shaped by a mix of internal and external factors. Between 2008 and 2023, DI solidified as a key source of external financing for the country’s economic activity, averaging a net flow of USD 483 million annually during this period (Graph 1).
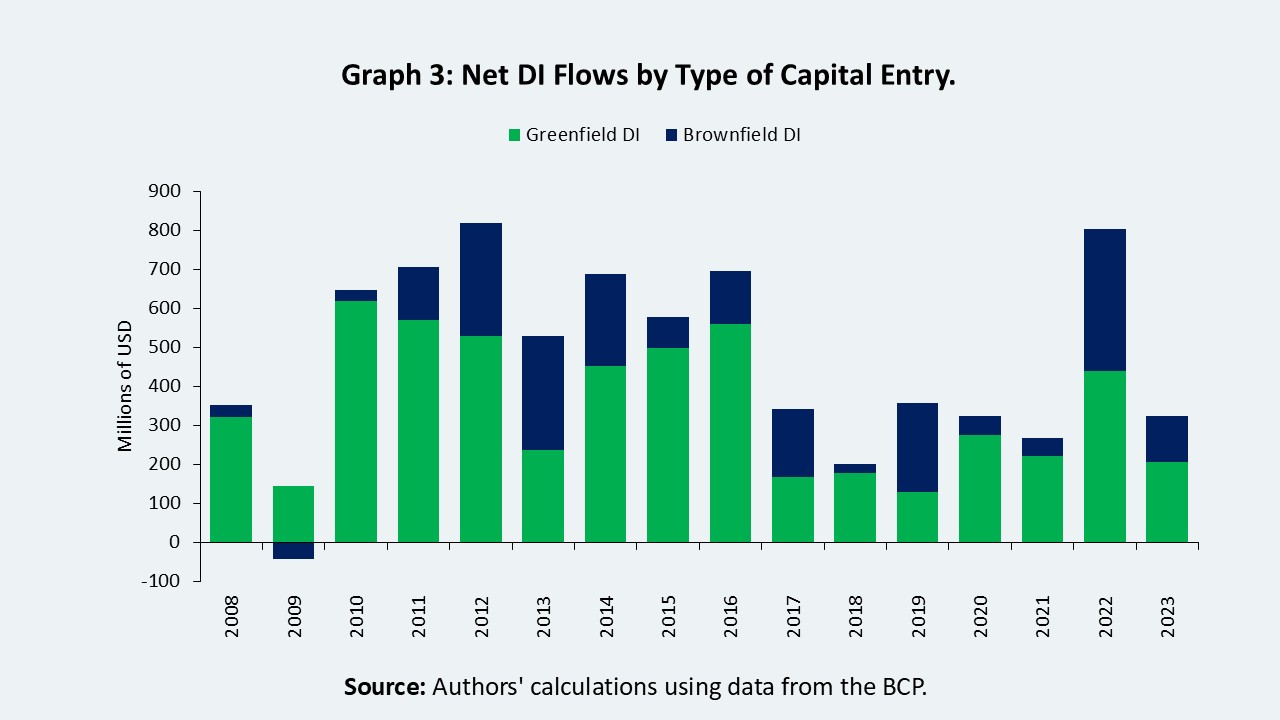
When analyzing the type of investment, it is evident that flows related to greenfield investments were higher than those of brownfield investments in most years between 2008 and 2023 (Graph 3). In 12 of the 16 years studied, greenfield investments exceeded brownfield investments, particularly between 2010 and 2016, when they reached significantly higher levels, with peaks of more than USD 500 million.
This trend indicates a preference among foreign investors for creating new projects and physical assets in the country, which is typically associated with a more sustained investment commitment and a greater long-term outlook.
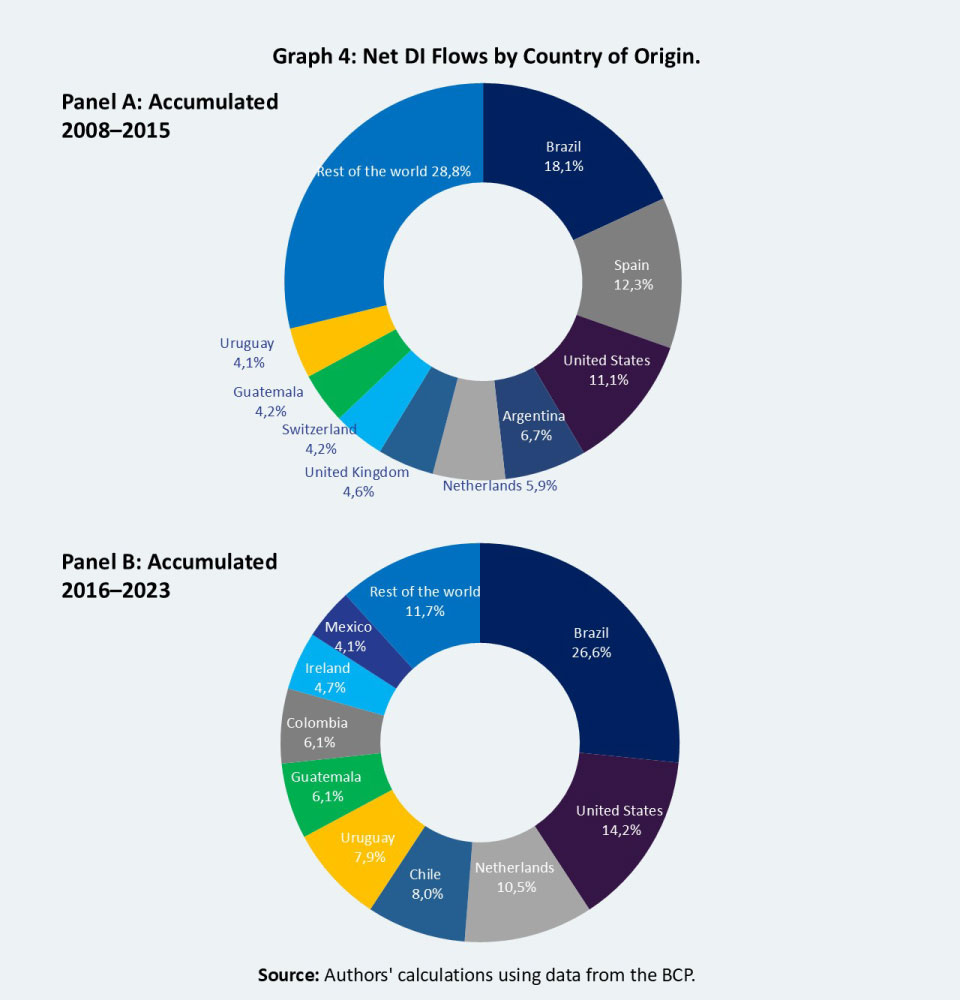
In terms of origin, Paraguay has received IDs from an increasing number of countries in recent years, reflecting a broader diversification of the sources of capital flows into the country. While in 2008 the DI came from 36 countries, by 2023 this number grew to 56 countries, demonstrating a wider and sustained international interest in the opportunities offered by the Paraguayan economy.
When analyzing the composition by country of origin, during 2008-2015, the main investments originated from Brazil (18.1%), Spain (12.3%), the United States (11.1%), Argentina (6.7%), and the Netherlands (5.9%) (Graph 4, Panel A).
During 2016-2023, countries such as Brazil, the United States, and the Netherlands significantly increased their share of DI flows, reaching 26.6%, 14.2%, and 10.5%, respectively, cementing their roles as key players in Paraguay’s external financing. Additionally, there has been a rise in the relative importance of other regional countries, notably Chile (8.0%) and Uruguay (7.9%), reinforcing the role of regional partners in Paraguay’s DI dynamics (Graph 4, Panel B).
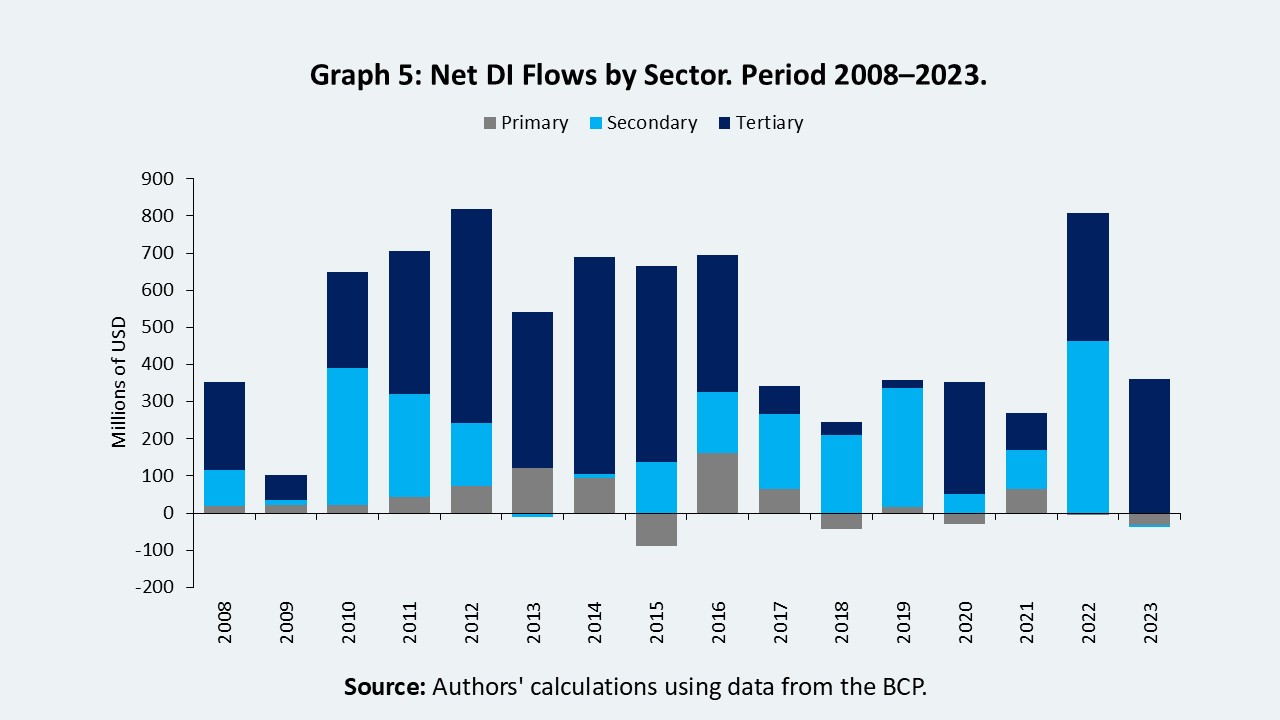
The secondary sector exhibited more fluctuations but performed notably well, accounting for 41.9% of the DI between 2008 and 2011. It decreased to 11.8% during 2012–2015, then rebounded significantly between 2016 and 2019, reaching 56.3% of the DI. In the last four-year period, 2020–2023, it maintained a high level with 35.9%, reaffirming its importance within the country’s productive diversification strategy.
Conversely, the primary sector’s share was considerably lower in relative terms, although it experienced a rebound from 2016 to 2019, reaching 12.3% of the DI. Between 2020 and 2023, it registered a slight negative cumulative change (-0.1%). In absolute terms, the cumulative DI by period was USD 1,807 million from 2008 to 2011, USD 2,611 million from 2012 to 2015, USD 1,595 million from 2016 to 2019, and USD 1,718 million during 2020–2023.
The dynamics and diversification of DI in Paraguay demonstrate the country’s capacity to attract investment despite recent global challenges marked by economic and geopolitical uncertainty. In this context, establishing a solid regulatory and institutional framework has been crucial for maintaining a favorable investment environment, recently highlighted by the achievement of investment grade by Moody’s Risk Rating Agency. With a consistent strategy to attract capital, Paraguay has the opportunity to keep strengthening its economy while solidifying its status as an attractive destination for ID in Latin America.
Referencias
Giraldo, Carlos; Giraldo, Iader; Gomez-Gonzalez, Jose; Uribe, Jorge (2025). US uncertainty shocks, credit, production, and prices: The case of fourteen Latin American countries. Research in International Business and Finance. Volume 78, June.
Turner, Philip; Giraldo, Iader (2022). The dollar debt of companies in Latin America: the warning signs. FLAR Working Paper. February.